I did load testing of self-hosted temporal deployment
temporal version: 1.25
postgres17 m7g8xlarge single az
deployed on aws managed k8s with 12 pods for frontend, matching and history service each
Have configured HPA as well to scale horizontally and ensured it doesn’t hit max replicas
20 pods for worker with 20k max concurrent activity/workflow and 200 max poller for activity/workflow support
load testing, single workflow with 2 empty activities for 50rps, 100rps, 200rps, 300rps
On an average got 250ms latency for workflow completion and 80ms for workflow execute-call-to-schedule. Both of these metrics are custom and not from metrics emitted temporal.
- Is it good latencies considering workflow with 2 empty activities?
- Could it be improved by using temporal cloud? If yes, then what would be latency with temporal cloud?
Thanks 
Can you show
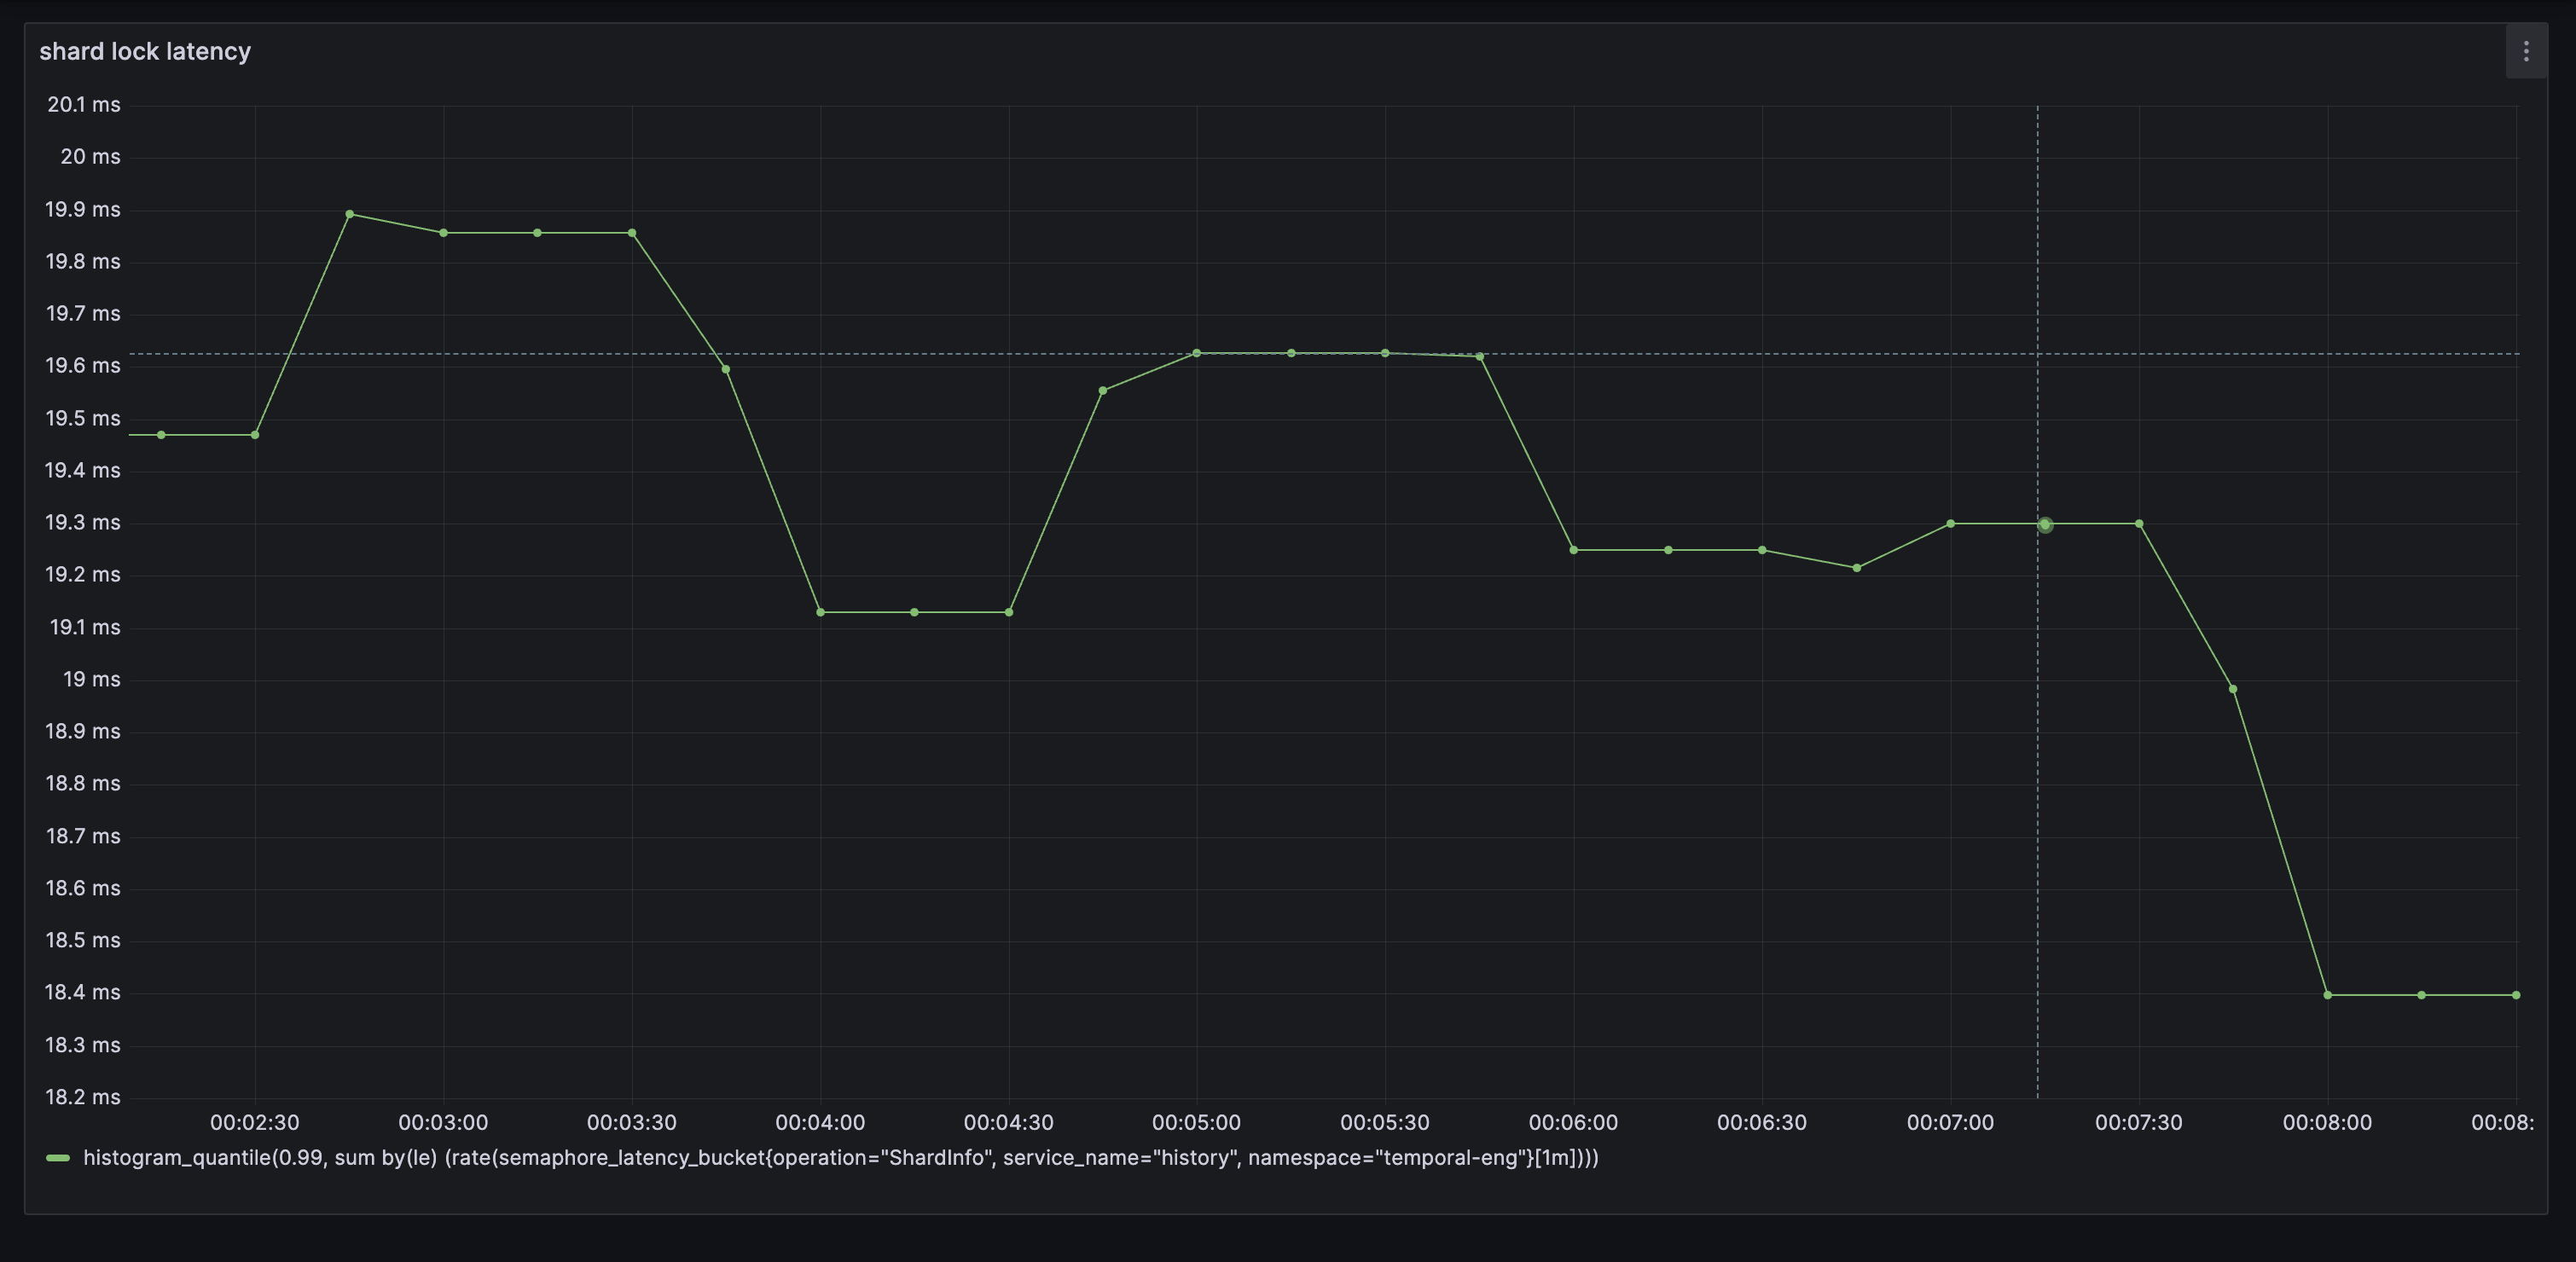
shard lock latency
histogram_quantile(0.99, sum by (le) (rate(semaphore_latency_bucket{operation="ShardInfo",service_name="history"}[1m])))
``
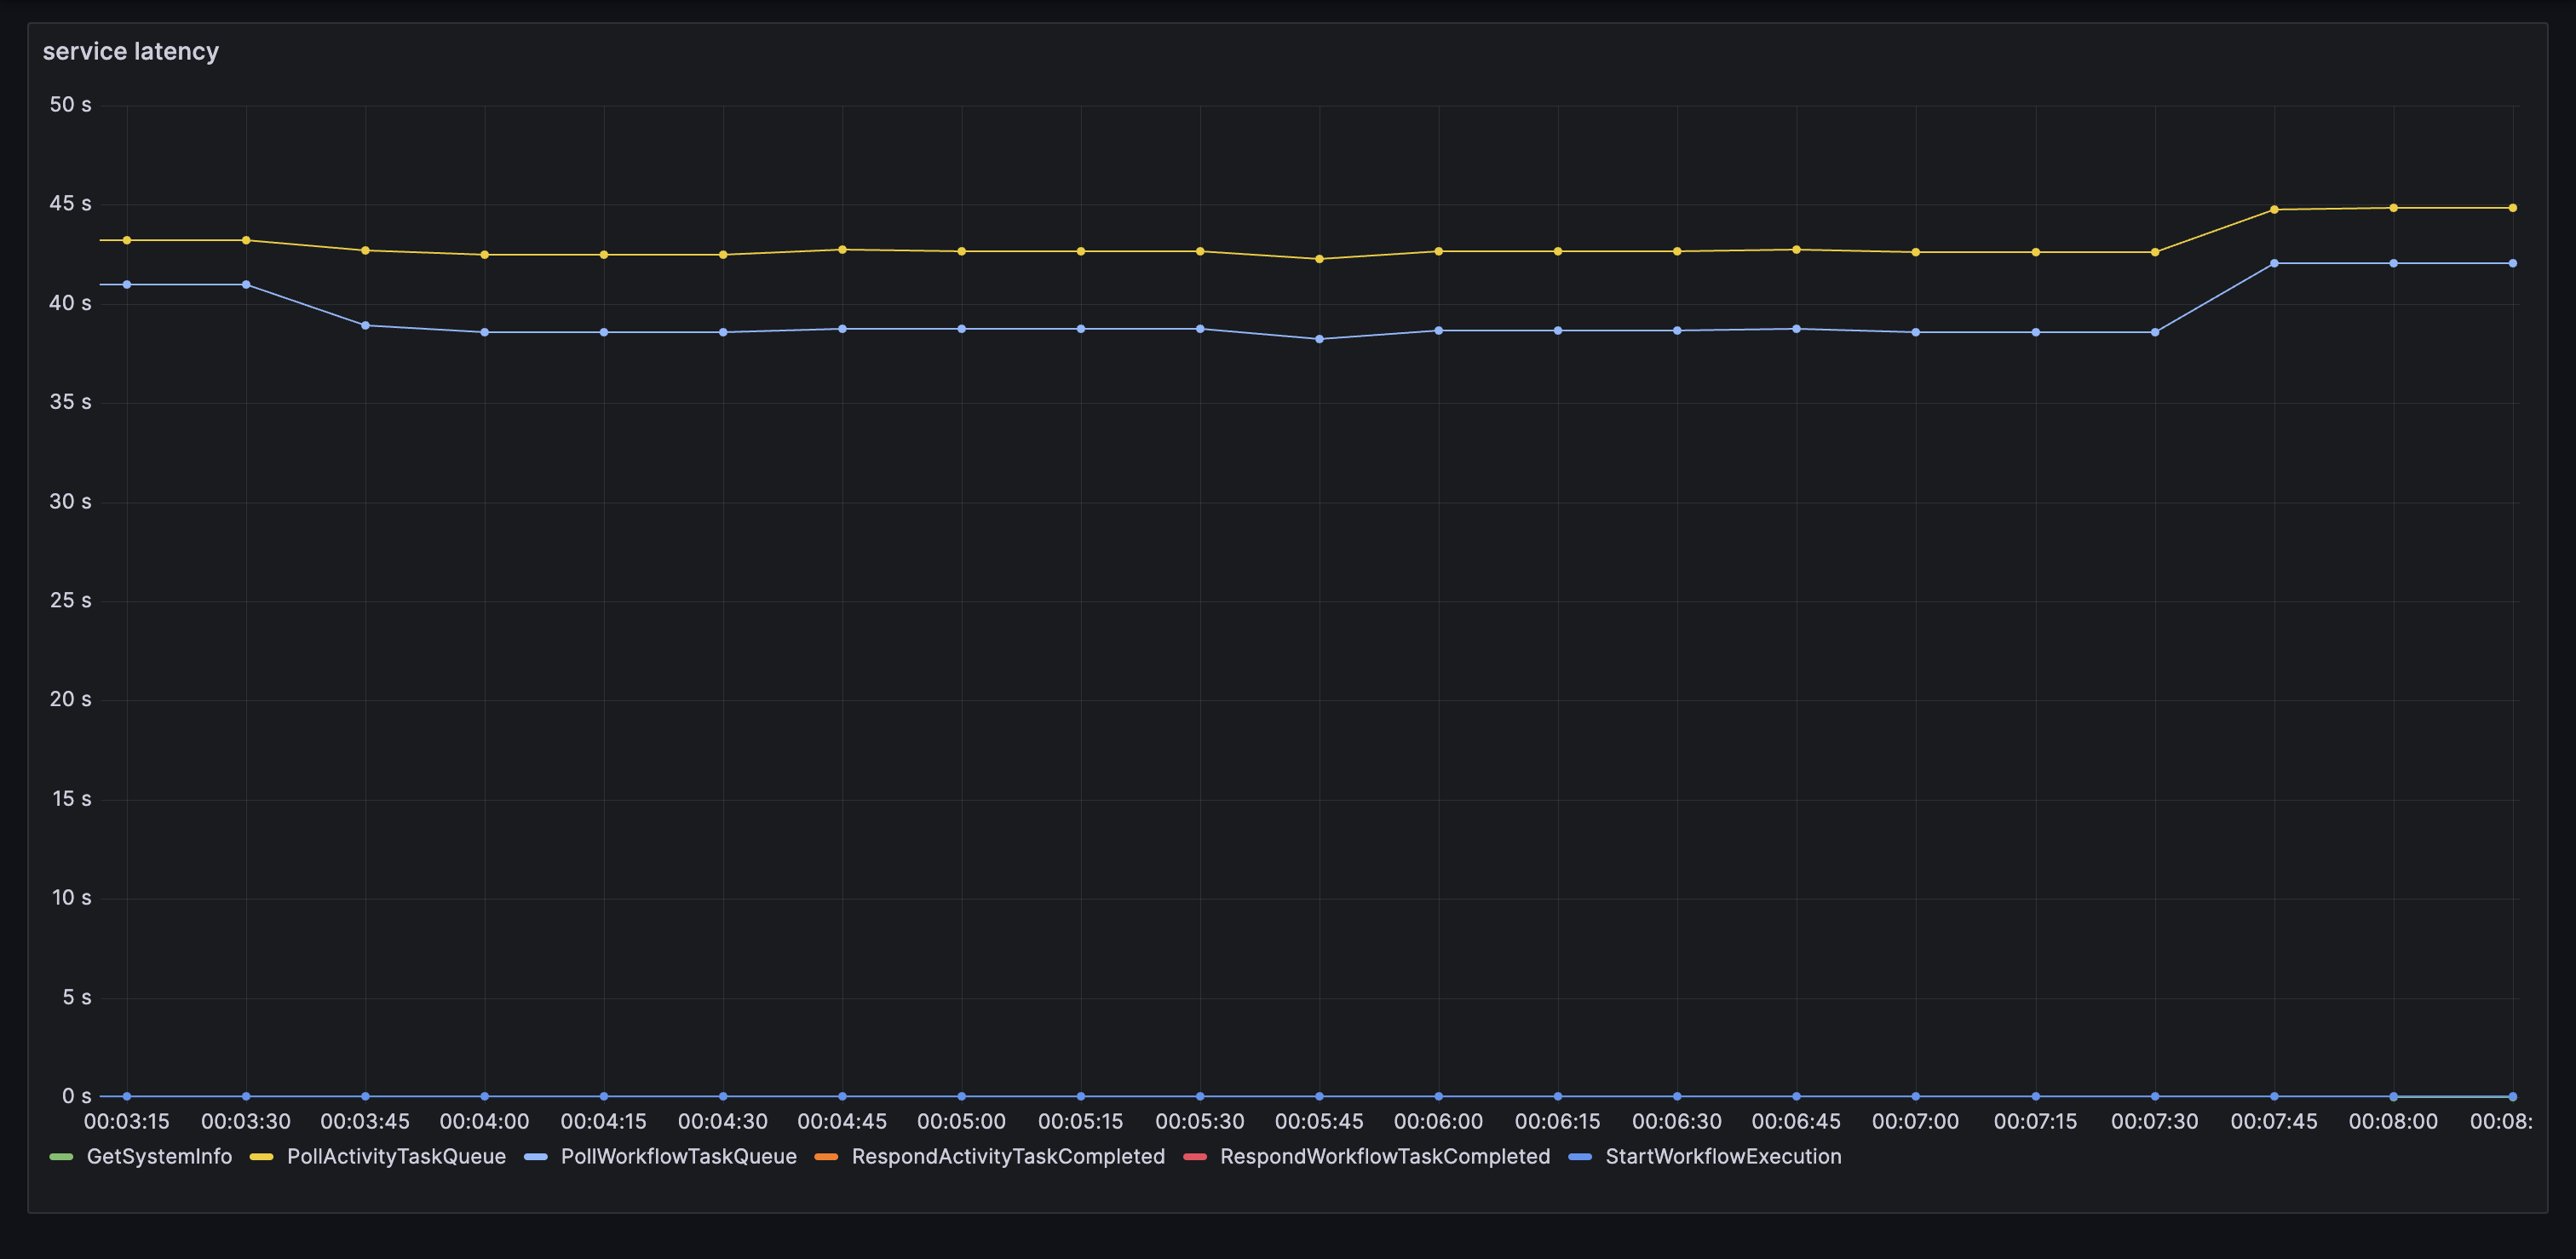
service latency
histogram_quantile(0.95, sum(rate(service_latency_bucket{service=“frontend”}[1m])) by (operation, le))
`
db latency
histogram_quantile(0.95, sum(rate(persistence_latency_bucket{}[1m])) by (operation, le))
resource exhausted errors
sum(rate(service_errors_resource_exhausted{}[1m])) by (operation, resource_exhausted_cause)
Is it good latencies considering workflow with 2 empty activities?
i think its hard to tell. understanding your db latency especially is imo important
Could it be improved by using temporal cloud? If yes, then what would be latency with temporal cloud?
docs here can help, but cloud would give you higher throughput and lower latencies in general, see Benchmarking Latency: Temporal Cloud vs. Self-Hosted Temporal | Temporal for example
db latency
service latency
shard lock latency
resource exhausted errors
exclude PollWorkflow/ActivityTaskQueue operations from your service latency graph (they are long-poll operations so can take up to 70s)
Updated service latency graph