Hi there!
I’ve noticed that ApproximateBacklogAge shows some taskqueues having a very old workflow in the taskqueue, but ApproximateBacklog count is 0 during these periods and when I go into the temporal UI I can see the workflows are completing reliably in under 10 minutes. So my assumption is if there is nothing in the backlog (count = 0), the backlog age should be 0.
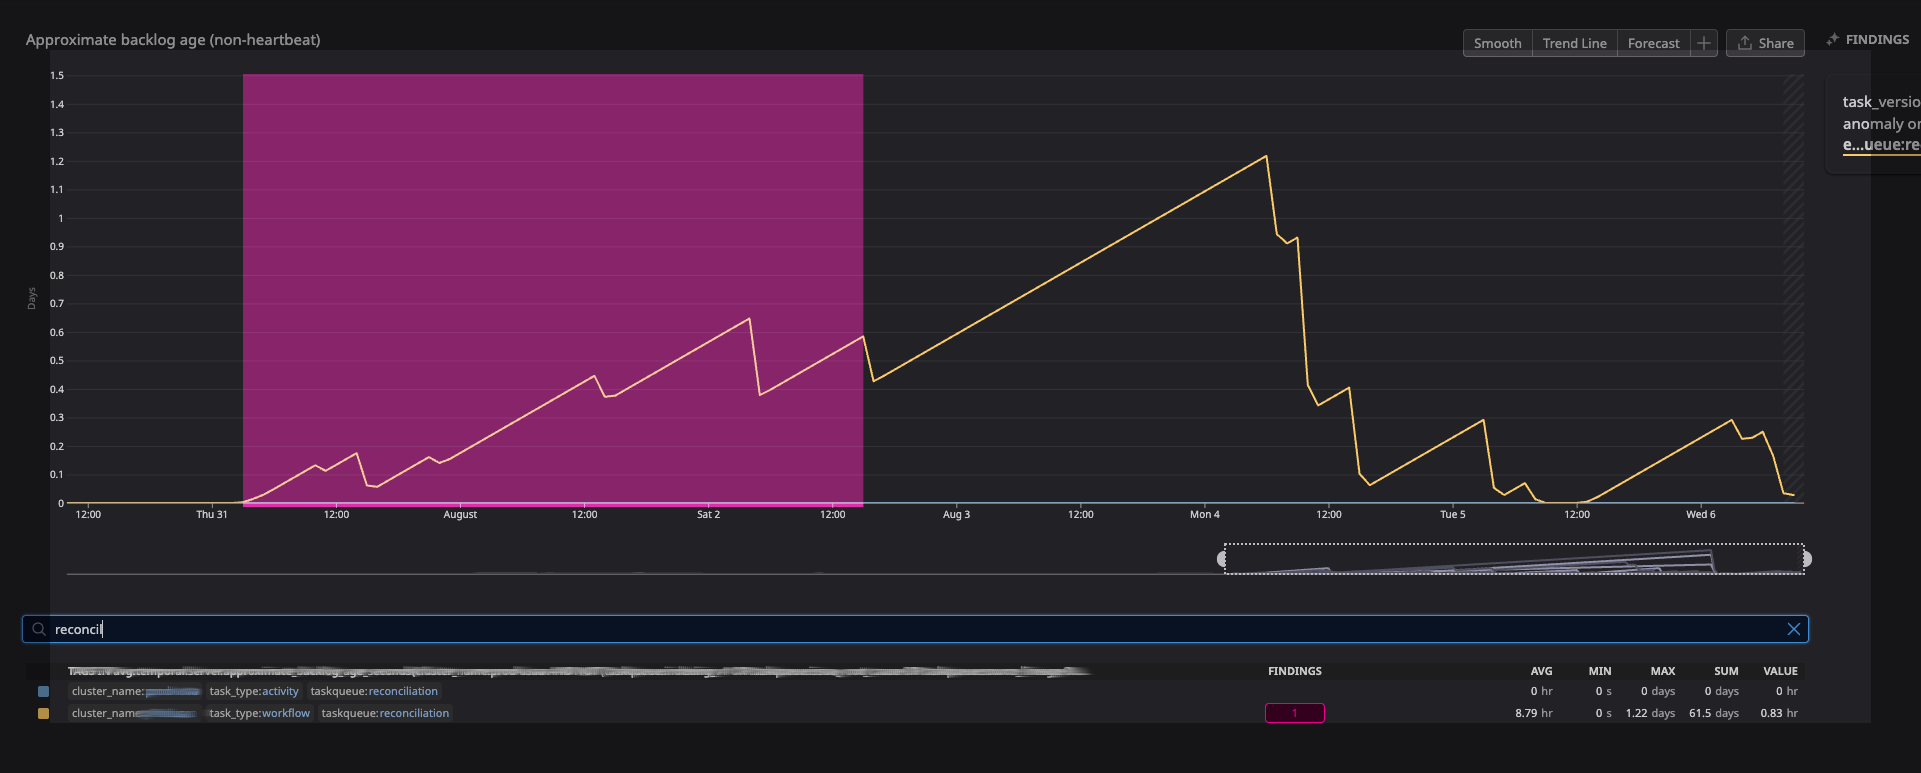
I took a screenshot below, this specific taskqueue “reconciliation” I thought would be a good example because it is on a 1 hour Temporal schedule, so it runs hourly and completes in about 10 minutes. There shouldn’t be any reason why ApproximateBacklogAge should build up to > 1 day, or perhaps I’m mistaken on what the stat represents. The “activity” tag for the stat shows correctly as 0, but the “workflow” tag for the stat for this taskqueue seems to have a mind of its own.
Am I using this stat wrong? Should I just ignore the workflow tag for this stat?
Temporal server version: 1.28.0
Temporal UI version: 2.39.0
I took a closer look. We have around a dozen temporal clusters, they all seem to exhibit the same behavior, it is quite a number of taskqueues that show the behavior to varying degrees, if not all of them. Some only build up to a couple hours before going back to 0 and then repeating, the pattern is not consistent either.
I did notice that there are some “activities” that are doing it as well so my initial report was inaccurate, it is just mostly workflows.
In our example, the “reconciliation” taskqueue, it is only the workflow backlog age. Activity backlog age is fine.
I have a test cluster that is less used so the signal is cleaner. On the entire cluster there are only 2 failed and 1 terminated workflows, none of which are on this Taskqueue.
For repro,
I don’t have a good way to set up for this specifically, but if on a clean cluster, adding an hourly task that does something trivial doesn’t trigger it, I’m not sure what could be the root cause.
Thank you! Really appreciate it. We’re in a spot where we feel like we can’t fully trust these metrics but the CLI seems to be giving us more believable answers.
does the incorrect values is cleared up after some time?
For backlog_age >> 0 when backlog_count = 0 its persisted and grown for 5+ days but I have not restarted any services during that time.
For the backlog_age = 0 when backlog_count >> 0 case, I’ve seen this persist for a very long time, event after restarts.
Some more information around case 2 and an example image:
This type of backlog issue seems to be per partition, and of task_type workflow. There are actually 2 partitions in this task_queue that show this behavior but in this screenshot I’m sharing one:
We see something like this happening for activities. We have a particular partition which perpetually reports a large activity backlog on approximate_backlog_count(operation:taskqueuemgr,partition:1,service_name:matching,task_type:activity,taskqueue:indexing,type:matching). My initial assumption was that this happens due to orphaned activities due to worker pod restarts without gracefully shutting down. But, every restart does not seem to be causing a stepwise increase in this number. Again checking stats locally does not show anything out of the ordinary. The reason this metric is more critical for us is, we use it to scale our worker pods using keda scaled object. Not sure if this is an issue related to what is being discussed.
Just to update here in case anyone stumbles upon this. Apparently this issue should be fixed in https://github.com/temporalio/temporal/pull/8375. This commit wasn’t included in the recent 1.29.0 release and hasn’t been ported to the release/1.29.x branch but I’m hopeful that we’ll get this bug-fix in 1.30.0
Hey all! We’re noticing what looks like the same issue on our cluster, specifically after upgrading to 1.28.1 (rolling back to 1.27.2 fixed it).
I scanned through the Github issue/PR (thank you!), but I’m not sure if it’s exactly the same bug. When I inspect the raw metric values from our cluster, it keeps increasing for the same (partition, host). The Github issue sounds like it describes a bug where we fail to reset the metric for a given (partition, host) and thus emit stale values, but in that case I would expect the metric value to remain constant. Could anyone from the Temporal team chime in?
I just wanted to circle back on this, it does looked fixed now, I am running 1.29.1 . Thank you so much to those who were involved in fixing this, we are going to use this stat a lot!