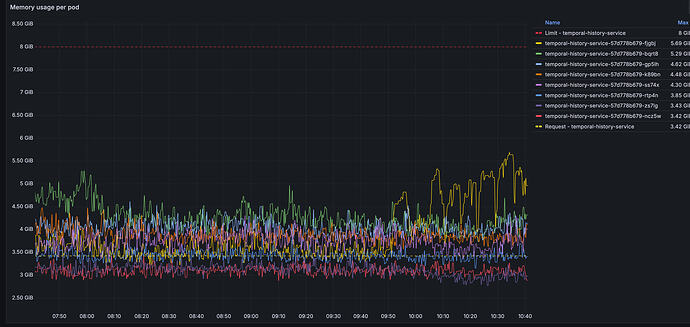
We are experiencing a situation where a single pod in our temporal-history-service deployment starts to act up. It begins to consume a lot of memory and open many connections to the backing postgres database. This is not the first time we’ve encountered this but were hoping that it would be fixed in 1.29.2, in the past we had seen this on 1.28.0.
Memory consumption graph:
New open connections graph:
Is this something that others have seen? It leads to Temporal-cluster-wide instability and problems dequeueing tasks. Restarting the temporal-history-service deployment seems to help when this happens but it does not feel like a robust solution.
I would love to share logs or other graphs. This seems like a relatively large problem. No actions occurred between this working as expected and it acting up

