Hi all,
We encountered a weird issue where a workflow is returned from ListOpenWorkflow but when getting it or trying to execute any command on it results in an error that the workflow is already closed is being returned.
Here’s what it looks like in the UI when listing workflows:
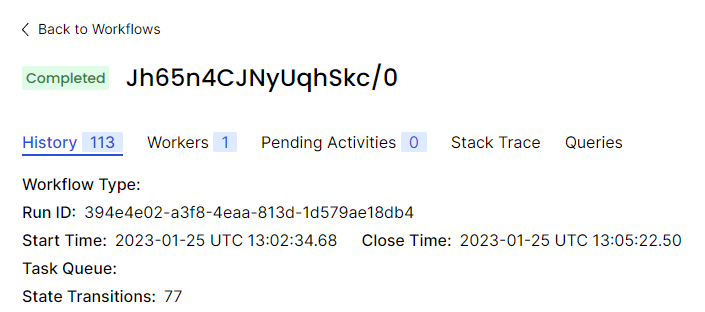
And this is what is shown when opening its details page:
Initially, I thought that it might be an eventual consistency issue, but nothing strange has been logged for it; neither has the state updated since the 25th of January.
Any ideas on how to handle this issue?
Edit: Note that while this has been going on other workflows are being created and manage to finish successfully.
Do you configure standard or advanced visibility (ES)?
Can you check visibility latencies (server metrics) around this executions completion time (also check visibility store and also check history and ES logs too.
histogram_quantile(0.95, sum(rate(task_latency_bucket{operation=~"VisibilityTask.*", service_name="history"}[1m])) by (operation, le))
I assume if you run
tctl wf desc -w <wfid> -r <runid>
you will see it as completed as well. seems completion update failed to be written to visibility for some reason.
We are using stantard visibility, stored in Cassandra. The Temporal version is 1.18.4.
This is how the requested graph looks like around the time of the workflow:
The first green line marks the time workflow was halfway done and the first red line is around the time the workflow was closed, according to the times in the UI.
Here’s the output of the tctl command for this particular workflow (yes, it shows completed status):
./tctl --address <addr>:7233 wf desc -w "Jh65n4CJNyUqhSkc/0"
{
  "executionConfig": {
    "taskQueue": {
      "name": "WorkflowRunner",
      "kind": "Normal"
    },
    "defaultWorkflowTaskTimeout": "10s"
  },
  "workflowExecutionInfo": {
    "execution": {
      "workflowId": "Jh65n4CJNyUqhSkc/0",
      "runId": "394e4e02-a3f8-4eaa-813d-1d579ae18db4"
    },
    "type": {
      "name": ""
    },
    "startTime": "2023-01-25T13:02:34.680222961Z",
    "closeTime": "2023-01-25T13:05:22.503776559Z",
    "status": "Completed",
    "historyLength": "113",
    "memo": {

    },
    "searchAttributes": {
      "indexedFields": {
        "BinaryChecksums": "[\"7338b8b8d0c371f416f788c76533c44b\"]"
      }
    },
    "autoResetPoints": {
      "points": [
        {
          "binaryChecksum": "7338b8b8d0c371f416f788c76533c44b",
          "runId": "394e4e02-a3f8-4eaa-813d-1d579ae18db4",
          "firstWorkflowTaskCompletedId": "4",
          "createTime": "2023-01-25T13:02:34.957424254Z",
          "resettable": true
        }
      ]
    },
    "stateTransitionCount": "77"
  }
}
I checked the history service logs but did not find anything interesting for that particular workflow ID. Can the error logs not be tagged with it? Shall I search for errors around the completion time of the workflow?
We are using stantard visibility, stored in Cassandra
can you check any resource exhausted issues during the same time:
sum(rate(service_errors_resource_exhausted{}[1m])) by (operation, resource_exhausted_cause)
check for any “SystemOverloaded” cause
I couldn’t find such metric, so I used the service_error_with_type one. There are two types of errors around that time, but I don’t think there is a cause in the metric tags.
- AddWorkflowTask (green)
- RecordWorkflowTaskStarted (brown)
Ok so seems low visibility latencies and no system overloaded. Would re-check history service logs and maybe check your cassandra logs too.
You mentioned you havent experienced this issue since, right?
You mentioned you havent experienced this issue since, right?
Yes, this happened for exactly one workflow and never since.
Today, I noticed that there were some pod restarts of all temporal services (frontend, history, matching, and worker) very close to the time of the issue. Since it is a test environment, I haven’t configured any horizontal scaling, so the services were not being restarted gracefully - there was a period of downtime for each one of them. Can that be related to my issue?
Edit: Actually, everything in the Kubernetes cluster was being restarted at some point, including the Cassandra. This was caused by an upgrade to a higher cluster version.
Edit (2): I guess that kind of settles what happened. I will configure proper horizontal scaling for the temporal services and test such scenarios again before deploying to production. Is there a way to manually fix the current workflow, so that it doesn’t show as running?