Unable to view prometheus metrics using Spring boot 3

Hi team! Following the instructions shared in the metrics for JDK documentation on observability#metrics. I am setting up a Bean of type TemporalOptionsCustomizer<WorkflowServiceStubsOptions.Builder> as mentioned in this document: https://github.com/temporalio/sdk-java/tree/master/temporal-spring-boot-autoconfigure-alpha#customization-of-options).

But when I go to /actuator/prometheus endpoint, all metrics except the temporal ones are showing up. Can someone please help identify if I am missing something? My workers come up and I am able to run workflows no problem.

I have uploaded the source code here: https://github.com/gauravojha/learning-temporal

Basically, my build.gradle has this snippet

dependencies {
	implementation 'org.springframework.boot:spring-boot-starter-web'
	testImplementation 'org.springframework.boot:spring-boot-starter-test'
	implementation 'org.springframework.boot:spring-boot-starter-actuator'
	implementation 'io.temporal:temporal-spring-boot-starter-alpha:1.20.0'
	implementation 'io.micrometer:micrometer-registry-prometheus'
}

And the bean looks like

@Bean
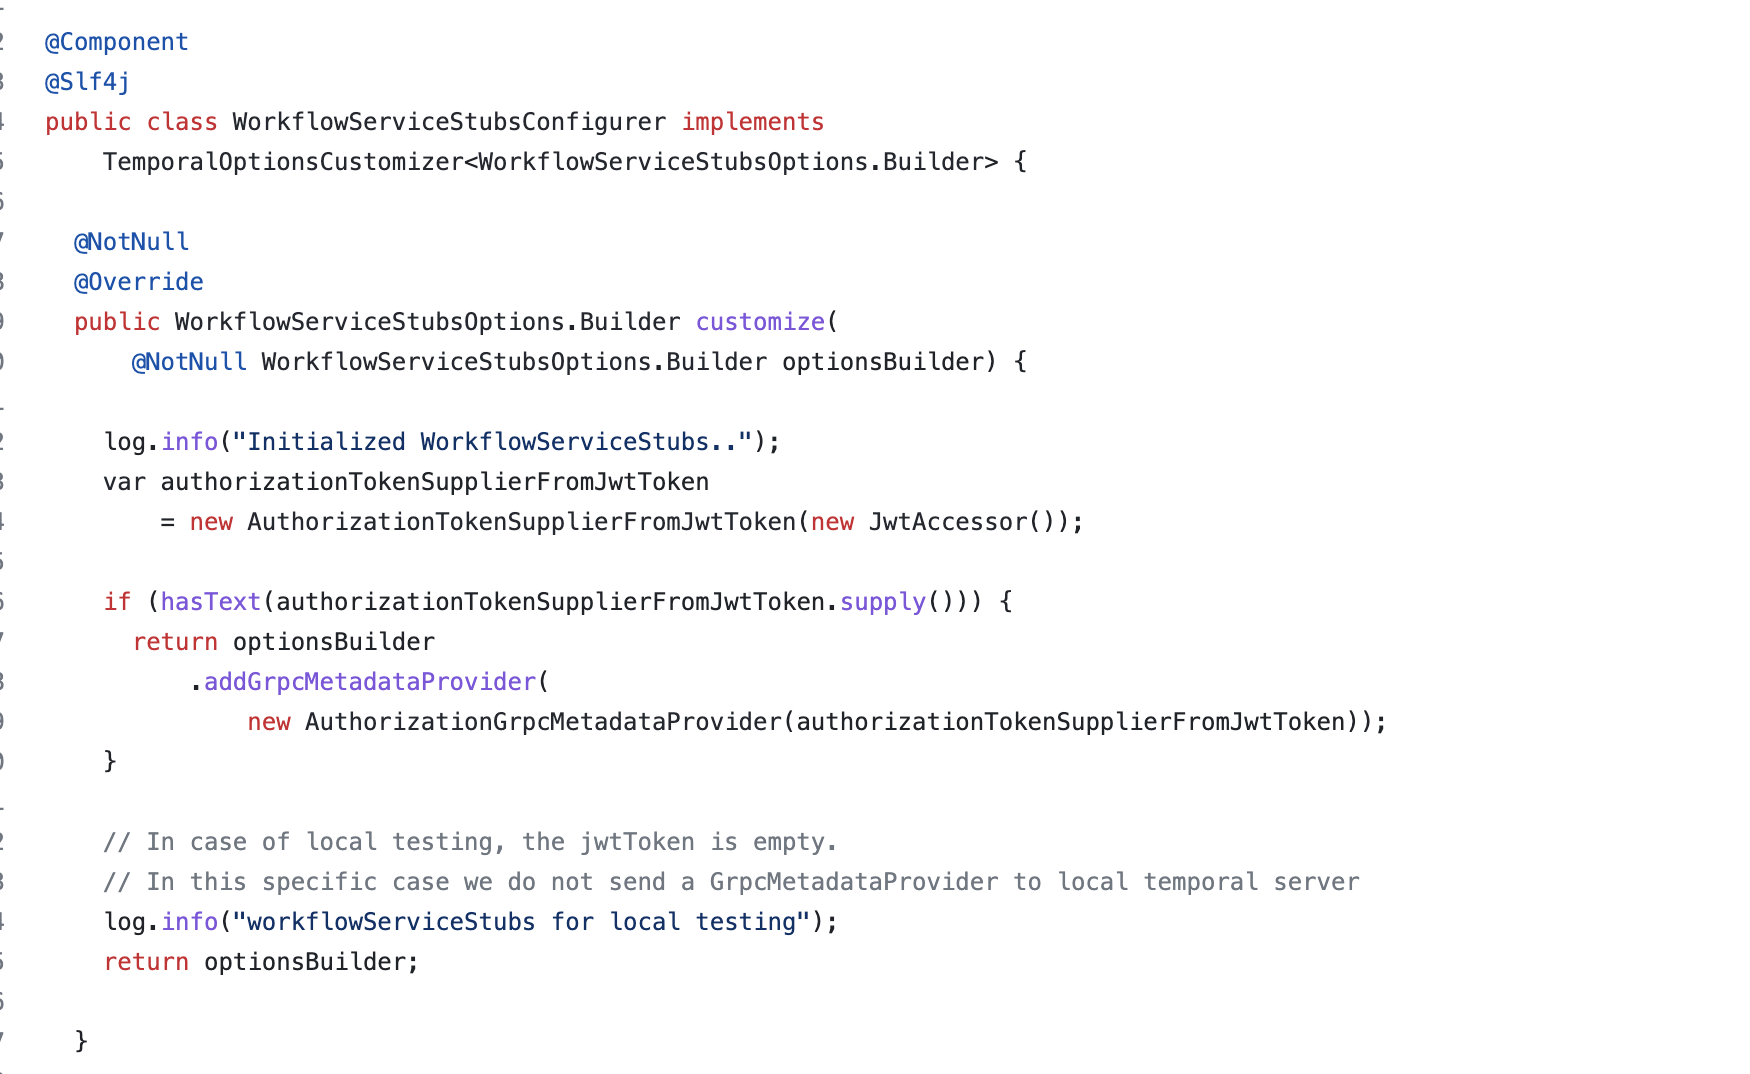
  public TemporalOptionsCustomizer<WorkflowServiceStubsOptions.Builder>
      customServiceStubsOptions() {
    return new TemporalOptionsCustomizer<>() {
      @Nonnull
      @Override
      public WorkflowServiceStubsOptions.Builder customize(
          @Nonnull WorkflowServiceStubsOptions.Builder optionsBuilder) {
        PrometheusMeterRegistry registry = new PrometheusMeterRegistry(PrometheusConfig.DEFAULT);
        StatsReporter reporter = new MicrometerClientStatsReporter(registry);
        Map<String, String> mp = ImmutableMap.of("ojha", "ojha");
        // set up a new scope, report every 1 seconds
        Scope scope =
            new RootScopeBuilder()
                .tags(mp)
                .reporter(reporter)
                .reportEvery(com.uber.m3.util.Duration.ofSeconds(1));
        optionsBuilder.setMetricsScope(scope);
        return optionsBuilder;
      }
    };
  }

I don’t see any error reported in the logs. I followed the examples in temporal-java-samples project, and I do not see any metric specific configuration, or anything which is different than what I have in my project above.

Link to the metrics documentation I followed: Java SDK developer's guide - Observability | Temporal Documentation

We have spring boot sample that shows how to config actuator and sdk metrics if that helps. If you use temporal-spring-boot-starter there is i think no need for your to set up custom WorkflowServiceStubs and metrics scope, its done for you via application config. Note the samples use SpringBoot 2

Thanks @tihomir … yeah I am already configuring my project with temporal-spring-boot-starter, and I compared my project with the sample provided, perhaps I am missing something very basic, but I do not see any difference. If I remove the custom WorkflowServiceStubs I have, still nothing shows up on prometheus endpoint. I will next try with spring boot 2, just to make sure its not a spring boot 3 thing, but I would really appreciate if someone in the community could (if they have time) glance through the repo I have added to see if I am making a mistake. Even the library versions are same as the one in samples.

Update:
I just tried with spring boot 2 (same version in samples) as well, same result… Even tried switching between JDK 11 and 17 just to make sure

// portion of build.gradle
plugins {
	id 'java'
	id 'org.springframework.boot' version '2.7.13'
	id 'io.spring.dependency-management' version '1.1.0'
	id 'com.diffplug.spotless' version '6.19.0'
}

group = 'dev.gauravojha'
version = '0.0.1-SNAPSHOT'

java {
	sourceCompatibility = JavaVersion.VERSION_1_8
}

Will look at your repo, just fyi I think you forgot to commit the gradle wrapper jar here: https://github.com/gauravojha/learning-temporal/tree/main/gradle/wrapper

Thanks @tihomir !! Appreciate the help. Just added the jar

Did you try changing https://github.com/gauravojha/learning-temporal/blob/main/src/main/resources/application.yml#L5

to

include: prometheus

and then look at http://localhost:8080/actuator/prometheus

“*” should also work fine. maybe you were looking at different actuator url?

yup, tried that as well, to cross out any weird thing which ‘*’ might cause… but nope, same result

same result

just to confirm with this you mean you do not see any metrics that start with “temporal_” on the http://localhost:8080/actuator/prometheus endpoint? What do you see instead?

The only other diff i see now is

try changing to runtime only: https://github.com/temporalio/samples-java/blob/main/springboot/build.gradle#L12

Thanks @tihomir

just to confirm with this you mean you do not see any metrics that start with “temporal_” on the

Yes. I don’t see any metrics with temporal_. I see all other system and application metrics, but no Temporal SDK metrics. Attaching a screenshot

try changing to runtimeOnly

Yup, tried that as well. In fact I have pushed a new branch with these changes as well: GitHub - gauravojha/learning-temporal at more_tests if someone wants to take a stab at running the application.

I also tried a couple more things:

  1. changed the namespace to “default”. No change
  2. copied springboot TemporalOptionsConfig config class into my branch, and removed the earlier Bean config I was doing. Same result

I have a feeling i am missing out on a very basic config somewhere, but the repo is already stripped down to a very minimal codebase, so comparing with the samples repo 1:1, I am unable to see what I am missing out on :frowning:

Was able to run your demo and yeah can reproduce.

I have a feeling i am missing out on a very basic config

Yeah you were right :slight_smile:

change

target: local

to

target: 127.0.0.1:7233

and you should see sdk metrics in /actuator/prometheus, no other changes required

1 Like

Found reason for this in sdk: https://github.com/temporalio/sdk-java/blob/master/temporal-spring-boot-autoconfigure-alpha/src/main/java/io/temporal/spring/boot/autoconfigure/template/ServiceStubsTemplate.java#L69-L71

if you set target to “local” it creates
WorkflowServiceStubs.newLocalServiceStubs();

and does not register metricsScope…filed issue here.

1 Like

Thank you!! I appreciate your help on this… yup, i can see the metrics now…

Hi Tihomir,

Am facing the same issue too. I don’t see temporal metrics, everything else is coming.
We are using temporal spring boot autoconfigure module. I have added the config, not sure what am I missing.


Do we need to add any port here for temporal metrics?

I see here a different port, samples-java/springboot/src/main/java/io/temporal/samples/springboot/metrics at main · temporalio/samples-java · GitHub

I deploy this on kubernetes do port forwarding and check.

And i don’t see temporal metrics.

@tihomir Could you please help